2021: Volume 1, Issue 1
Past Issues
 Abstract
  PDF
PDFFormulas for Determining Ideal Weight and Its Relationship to the Body Mass Index in Adults
Gerardo Jose Bauce1*, Mary Zulay Moya-Sifontes2
1School of Nutrition and Dietetics. Faculty of Medicine. Central University of Venezuela
2School of Nutrition and Dietetics. Faculty of Medicine. Central University of Venezuela
Corresponding author: Gerardo Jose Bauce, Master in Management. Professor of Statistics. School of Nutrition and Dietetics. Faculty of Medicine. Central University of Venezuela. Email: [email protected]; Telephone: 0412-5733044. http://orcid.org/0000-0002-6087-3968
Received: November 05, 2021
Published: November 30, 2021
ABSTRACT
Objective: Compare five ideal weight calculation formulas, to suggest using one of them, as a complementary measure to evaluate Overweight and Obesity. Methods: Descriptive, prospective, correlate and analytical study. Sample consisting of 519 adults of both sexes, between 20 and 65 years old. The study was reported and requested consent, according to the WMA, Helsinki statement. Formulas: Broca, Lorenz, Perrault, Ramírez-López et al., and Wan der Vael; descriptive measures, association, correlation and comparison of means were identified. Results: the formulas differ in averages, are significant by sex for Lorenz, Ramírez-Lopez and Wan der Vael; percentages by category are high in Moderate Malnutrition (55.1%) overweight bass (3.3%) obesity (3.1%), however for standardized values are lower in Moderate Malnutrition (14.3%), high in Normality (68.2%) moderate in overweight (13.9%) Obesity (3.5%). BMI has moderate values for Normality (36.4%), very high for overweight (34.7%) obesity (25.0%), with the original values, while with the standardized values the percentages are Normal (71.1%), Overweight (11.2%) Obesity (4.1%). BMI category averages behave similarly for all five IP formulas, and are lower in Obesity. In terms of percentiles, the five formulas behave very similarly. Conclusion: Ideal Weight can be considered as a complementary measure to classify people into Overweight and Obesity, particularly standardized values; correlates with Size and Weight and are associated with BMI (p<0.000).
Keywords: Formulas, Ideal Weight, Real Weight, Body Mass Index, Overweight, Obesity, Sensitivity
INTRODUCTION
The ideal weight concept began in 1983 when the Metropolitan Life Insurance Company drew up tables that related the weight of men and women in a standard population to their mortality risk, to be used as a basis for estimating the value of the insurance policy. Which were mistakenly called "ideal weight tables", the insurer subsequently changed that name to "desirable weight tables", to avoid misinterpretations. Over the years, the scientific community has not only criticized the naming of the tables, but also their methodology and therefore their scientific validity [1].
In such a way that, concepts of ideal or desirable weight not only last to this day, even though nutrition professionals prefer terms such as normal or adequate or reasonable or healthy weight and that is sometimes described as the one with which a person is at ease, who is associated with normal biological functioning and a mini-risk of incidence of disease and in which it is advisable that the person is [1].
One of the biggest challenges we face is assessing the body weight that each individual should have at different stages of life, it is considered that there are many factors that need to be evaluated to determine an ideal weight beyond using a formula [1].
Now considering that the ideal weight depends on factors such as the amount of fat, height, complexion, fluids being retained and muscle mass among others; in addition many researchers have established formulas or equations in which the weight, size, sex and age of the person are related [2].
Likewise, considering that as the Ideal Weight is another indicator that has at some point been taken into account in assessing the health of people, it is necessary to consider to what extent statements such as the above may be valid and acceptable; because as has happened with the Body Mass Index (BMI), of which some new equations have been proposed, such as a new formula proposed by Nick Trefethen (2013) [3],and the formula proposed by Ramírez-López et al., (2012) [4]. for the percentage of body fat, called by them, Healthy Body Weight (PCS), it is appropriate to do the same for the Ideal Weight.
The current concept of ideal weight is closely related to BMI. it makes sense to consider that the ideal weight would be that to keep the subject with a normal BMI, but with a margin of safety between the boundaries; that is why most ideal weight formulas are based on a BMI between 18.5 and 24.9 kg/m2 [4].
In reality, the right or normal weight is not a value; rather a fairly wide range obtained through the Body Mass Index (BMI), for the adult population between 20 and 65 years according to the World Health Organization (WHO) [5].
However, BMI has certain limitations that do not advise its indiscriminate and unfeedled use, for example, this occurs in the assessment of children and the elderly, since older people have less muscle mass than young adults and, therefore, the calculation of body mass index does not usually have the same meaning in the older population as in the rest of the adult population. Thus, a new BMI table was proposed, specially designed for people between the ages of 20 and 65. Similarly, BMI cannot be used in muscular people [6].
Under these statements and taking into account that several formulas have been suggested for the calculation of the ideal weight [7], which involve anthropometric measures (weight and size) of the person, and in some the gender, so the need arises to apply such formulas and compare the results, in a group of people of different ages, in order to determine whether or not the ideal weight actually exists.
On the other hand, it should be borne in mind that, according to data published by WHO [8], in 2016, more than 1900 million adults were overweight and more than 650 million were obese. At least 2.8 million people die each year from obesity or being overweight; which makes it possible to say that having another indicator to assess overweight and obesity is of great importance, since it can complement the evaluation obtained by the application of the BMI.
METHODS
It worked with a sample of 519 adults of both sexes aged 20 to 65. All adults were previously asked for informed consent for participation in the study, in accordance with the World Medical Association, WMA (2013), related to the Helsinki Declaration [9].
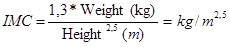
BMI was calculated using the Quetelet formula [10].
.png)
And for the Formula proposed by Nick Trefethen (2013) [3]
For this study, only five (5) formulas of the most commonly used were included, since the remaining formulas known for calculating the Ideal Weight (PI), include in their calculation circumference measurements and folds, information that is not available for this group of adults that make up the sample. The following formulas are considered below:
1. Broca Formula (1871) [11,12]:
Broca's formula is a fairly simple method, although in the case of very tall people, it can give error. Presented below
PI - A – 100 where (A s height in cm)
2. Perrault Dry Formula:
This formula is another variation of the Broca formula, although not too well known, takes into account the age of the subject although not the sex [11-12]. The following is:
PI - Height in cm - 100 + ((age/10) x 0.9)
3. Lorentz Formula [11-12]:
It is also a variation of the Broca formula but adding the gender variable.
PI – T – 100 – [(T – 150) / 4] + [(E – 20) / k]
Where T's height in cm; Age in years; k x 4 (Men) or 2.5 (Women)
4. Ramírez-López et al., Formula (2012) [4]:
This formula considers only the size for adults up to 65 years
PCS (0.797*Size) – 63,074 (Adults)
5. Wan der Vael Formula:
This formula takes into account height and gender [11-12]. It is presented below:
For man the formula is PI (height in cm – 150) x 0.75 + 50.
In the case of women, the formula is PI (height in cm – 150) x 0.60 + 50.
BMI classification criterion for adults ages 20 to 65 [5]
BMI less than 18.5 kg/m2 (Low weight); BMI between 18.5 and 24.9 kg/m2 (Normal); BMI between 25 and 29.9 kg/m 2 (Overweight); BMI between 30 and 34.9 kg/m2 (Grade I Obesity); BMI between 35 and 39.9 kg/m52 (Grade II Obesity) and BMI greater than 40 kg/m 2 (Grade III Obesity or Morbid Obesity).
Criterion for classifying the Ideal Weight (PI), applicable to the wholegroup, regardless of age and gender, is presented below [13]:
%PI- Current Weight *100/ Ideal Weight
% Of Ideal Weight Nutritional Situation
< 60Severe malnutrition
60 – 90Moderate malnutrition
90 -110 Normal
110 - 120 Overweight
> 120 Obesity
RESULTS
The averages and deviations of the Ideal Weight, obtained by the different formulas, are discriminated against by sex; it can be observed that all averages are slightly higher in the male sex; however, when comparing such averages by sex, in all formulas except Wan der Vael, they turn out to be not significant (p > 0.01); because for wan der Vael formula they turn out to be significant, (p < 0.000). However, it could be noted that for the Lorentz formula such averages are significant for a value of p > 0.01, although it is less than p x 0.02 (Table 1).
Table 1: Average, standard deviation and comparison of Ideal Weight averages, BMI, according to formula and sex
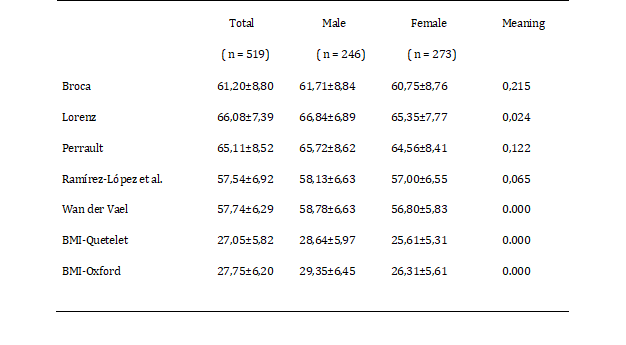
The different values of the Ideal Weight were then classified by percentage, and these have to range from 1.93% to 7.13% in Severe Malnutrition; 30.83% to 55.11% in Moderate Malnutrition; 31.6% to 44.5% in Normality; 3.3% to 14.3% in Overweight and 2.5% to 11% in Obesity. It is also noted that the results are quite similar in the different categories of the last two formulas (Table 2).
Table 2: Percentage rating, according to BMI calculation formula, from Adults 20 to 65 years old
Given this marked discrepancy in the percentages in the different categories of Ideal Weight between the different formulas used, the individual values obtained by each of the formulas were standardized, in order to eliminate the possible bias between these values, and to make the results more comparable, and these have to reveal that the percentages of Severe Malnutrition and Moderate Malnutrition are significantly decreasing; 66.67% to 71.48%; Overweight rates range from 9.63% to 13.87%, and obesity rates vary between 2.31% and 4.62%, maintaining some similarity in the same two formulas, with the exception of the Overweight category, where the difference between the two formulas (9.6% vs 13.9%) is slightly greater (Table 2).
Adults were classified, according to the BMI, according to the calculation formula, and it has that the percentages in each of the categories are similar, with the exception of the Low Weight category, in which the BMI-Quetelet has a higher percentage than BMI-Oxford (3.1% vs 1.7%; also for each calculation formula there is 38.7%and 33.4% in the Normal category, 33.5% and 30.6% in the Overweight category and 24.7% and 30.3% in the Obesity category, discriminated against in Obesity Grade I 16.4% and 18.9%, Obesity Grade II 5.2 2% and 7.5% Grade III Obesity 3.1% and 3.9%, respectively; there is also predominance of overweight and obesity in the male sex, for BMI-Quetelet, and predominance in the female sex for BMI-Oxford (Table 2). The averages obtained by the two formulas are compared, and turn out to be non-significant (p > 0.001); these averages are also compared, for the two formulas, by sex, and in both cases turn out to be significant (p < 0.000) (Table 3).
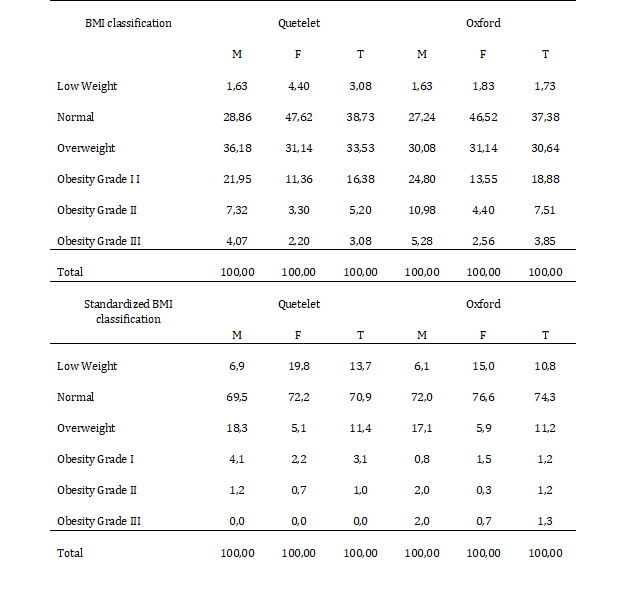
Table 3: Average and deviation of Ideal Weight, according to calculation formulas, by low weight group, Normopeso, Overweight and Obesity and classification categories
The percentages of the BMI classification are compared, and the original values have to be similar, both in both sexes and in total, with the exception of Grade II and Grade III Obesity, where they are higher in the male sex, for the Oxford BMI. Similarly, when comparing the percentages of standardized values, the percentages in the low weight and normal categories are higher the percentages of BMI-Oxford, are similar in Overweight; slightly higher in Grade I Obesity for BMI-Quetelet and slightly higher in Grade II and Grade III Obesity for BMI-Oxford (Table 2).
In relation to the averages of the different formulas of calculation of the ideal weight, compared by categories of BMI, Low Weight, Normality, Overweight and Obesity, the average Ideal Weight is higher in the overweight group for Lorenz and Perrault, and it is observed, in addition to remaining more stable, in the four groups, in the formula of Ramírez-López et al., and Wan der Vael; while BMI increases progressively, for all formulas, when moving from the Low Weight to Overweight category, but they are lower in the Obesity category, with the exception of Bit that remains equal to the average in Overweight (Table 3).
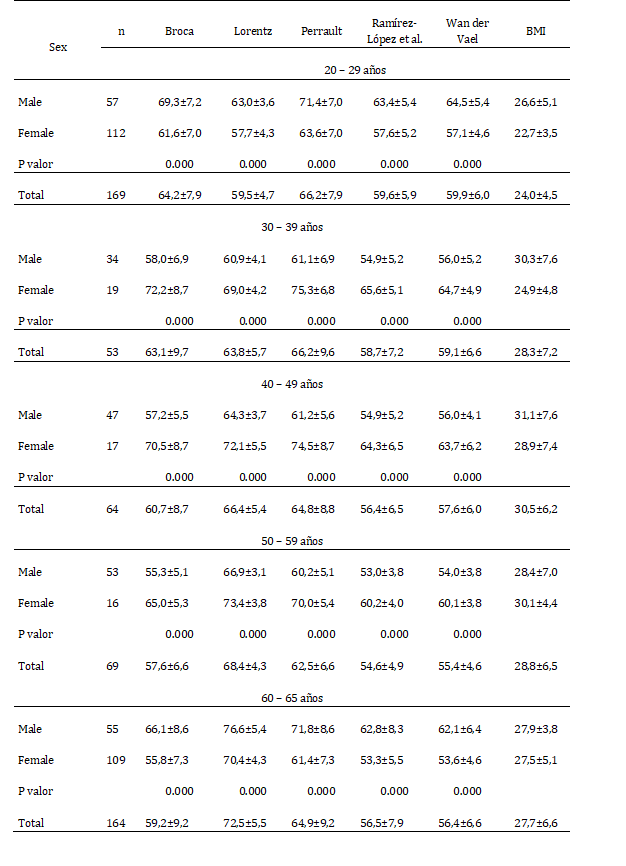
Likewise, the averages by sex and age group are compared, of the different calculation formulas and it has that for groups 20 to 29 years and 60 to 65 years, the averages are higher in the male sex, for all formulas, while for groups 30 to 39 years, 40 to 49 years and 50 to 59 years, the averages are higher in the female sex; Similarly, for all calculation formulas, gender differences are statistically significant (p < 0.000) (Table 4).
Table 4: Average and deviation, by age group and sex, according to the ideal weight calculation formula. Adults 20 to 65 years old
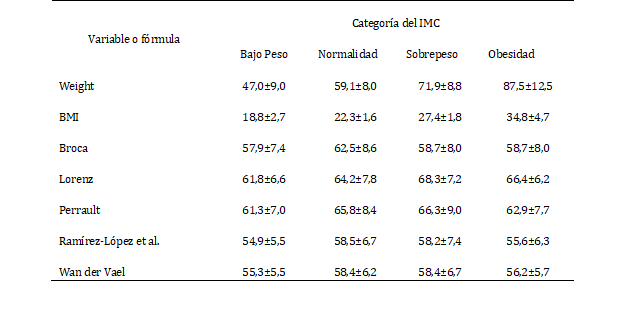
In addition, the percentages are compared, according to the standardized values, in the different categories of BMI, for the ideal weight calculation formulas, and you have for all the calculation formulas of the Ideal Weight, in the category Under Weight are much higher (they range from 32.76% to 62.24%) the percentage of BMI (3.85%);, however, in the Normality category are similar (ranging from 31.50% to 36.80%), with the exception of Lorenz (44.51%), and much higher in Overweight (34.68%) Obesity (25.05%) BMI, to those obtained in the ideal weight calculation formulas, which range from 3.66% to 14.26% in Overweight and between 2.5% and 10.98% in Obesity (Figure 1).
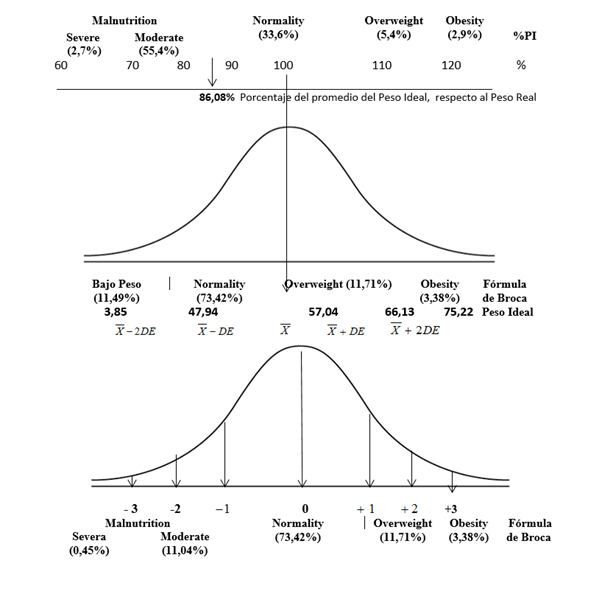
Figure 1: Classification of the Ideal Weight, according to the percentage of the actual weight, based on the average more or less standard deviation and typified values.
Correlations were obtained, by BMI classification category and it has that, for Low Weight only the Lorenz formula correlates with age (0.77); the formulas of Broca, Perrault, Ramírez-López et al., and Wan der Vael correlate with Size (1.00; 0.98; 1.00 and 0.99); and only Wan der Vael correlates with Weight (0.72). In Normality and Overweight, Broca correlates with Size (1.00 and 1.00) and Weight (0.84 and 0.85); Lorenz with Age (0.76 and 0.67); Perrault with Size (0.98 and 0.99) and with Weight (0.86 and 0.86); Ramírez-López et al., with Size (0.98 and 0.98) and with weight 80.84 and 0.86); Wan der Vael with Size (0.98 and 0.99) and with weight 80.84 and 0.85) Obesity. Broca correlates with Size (1.00); Lorenz with Age (0.67); Perrault with Size (0.99) and Wan der Vael with Size (0.99)
Association measures were applied between BMI and each of the formulas used to calculate the ideal weight, and the hypothesis was made that the Ideal Weight is independent of BMI, and the results reveal that the differences are significant, so the Ideal Weight depends on the BMI or is associated with BMI (p > 0.05).
In addition, the averages by BMI category are compared, and it is has that for the Lorenz and Perrault formulas, there are significant differences between Low Weight and the other three groups, between the normality and overweight and obesity averages and between Overweight and Obesity (p < 0.000). For the formulas Broca, Ramírez-López et al., and Wan der Vael, there are significant differences between the Low Weight averages and the other three groups, Normality, Overweight and Obesity (p < 0.000) (Table 3).
Similarly, averages are compared by age group, by gender, and have that for all calculation formulas the differences are statistically significant (p < 0.000) (Table 4).
DISCUSSION
Based on the results obtained, it can be said that of the five formulas used to calculate the Ideal Weight, they give rise to averages for the total group that differ, are greater for Broca, Lorentz and Perrault, while for Ramírez-López et al., and Wan der Vael, they are similar. When discriminating on the basis of sex, the behavior is that all averages are slightly higher in the male sex, and similar in the female sex for Ramirez-Lopez et al., and Wan der Vael. When comparing averages by sex, they are significant for Lorentz (p < 0.02) and Wan der Vael (p < 0.000).
When classified according to the percentage of the ideal weight, it is have that the Lorenz formula classifies a high percentage with Severe Malnutrition (30.8%); the formulas of Broca, Wan der Vael and Ramírez-López et al., classify more than 46.0% with Moderate Malnutrition; In addition, the averages by sex behave similarly, and are not significant for all formulas, except for the Wan der Vael’s formula (p < 0.000) and Lorenz (p < 0.05). It is noted that these formulas classify a high percentage into low categories, which may be due to the fact that the classification criterion is based on a percentage of the ideal weight on the actual weight. In addition, Wan der Vael's formula is the only one that takes sex into account.
Although none of the formulas correlates with BMI, the latter was considered a reference for classifying Overweight and Obesity, and the association between each of the formulas and the BMI was sought, to calculate the Sensitivity and Specificity of each, and the results indicate that the five formulas are associated with BMI (p <0.000); and all formulas have low sensitivity, while the formulas of Ramírez-López et al., and Wan der Vael have a high specificity (84.69% and 84.21%).
Moreover, the behavior of the five formulas, in terms of the percentiles is very similar (Figure 2); however it was observed that when classifying adults in different categories the percentages differ from one formula to another; in addition, the classification of a high percentage of adults in the categories Severe Malnutrition and Moderate Malnutrition may be due to the fact that the criteria do not correspond to reality, which is why this criterion should be revised to propose one that is more in line with reality.
Ideal weight or "normal weight" is the weight of a person who has a corpulence that can be considered "normal". The World Health Organization (WHO) uses the notion of Body Mass Index (BMI) to calculate this average. To be considered 'normal', our index should be between 18.5 and 25 kg per m2 [14]; and for this group of adults, there are 38.7% in Normality, which is very low; however when classified according to standardized values the percentage is 70.0%.
CONCLUSION
In view of the results obtained it can be concluded that it is possible to consider the Ideal Weight as a complementary measure to classify people who are overweight and obese; however, the classification criterion must be revised, as it tends to rank a higher percentage towards the lower categories, this isand presents a left bias; however, when classifying according to standardized values, the percentages in the different categories, tend to match in the different formulas; they also correlate with size, with weight and are associated with BMI; the latter suggests that it could be tested with a formula to calculate the Ideal Weight, which includes the BMI.
In addition, this article is a contribution to the definition of a specific formula for calculating ideal weight, in adults, and thus contributing to a better assessment of overweight and obesity in these age groups in Venezuela.
REFERENCES
- Carbajal Azcona A. Nutrition and Dietetics Manual. Ap. 2. Body composition. [Internet] (Cited: Apr 01, 2020). [Link]
- bePMF. Formulas to calculate your ideal weight. Aug 12, 2014. [Internet] (Cited: Apr 01, 2020). [Link]
- Trefethen Nick. University of Oxford. The Economist. 5 January 2013 [Internet] (Cited: Mar 04, 2020). [Link]
- Ramírez-López E, Negrete López NL, Tijerina Sáenz A. (2012). Healthy body weight: Definition and calculation in different age groups. Rev. Health Pub and Nutr. 13(4): 466-474. [Internet] (Cited: Mar 22, 2020). [Link]
- Onis M (2015). World Health Organization Reference Values. In M.L. Frelut (Ed.), THE ECOG'S ebook on obese children and adolescents. (Internet) (Cited: Apr 01, 2020). [Link]
- Baile JI. (2015). Is the use of the Body Mass Index to assess obesity in muscular people valid? Letters to the Editor. Nutr Hosp. 32(5): 2353-2354
- Castañeda D. According to WHO, this is the way to calculate your ideal weight. MSN lifestyle. 11/07/2019. [Internet] (Cited: Apr 01, 2020). [Link]
- Organización Mundial de la Salud. 10 Datos sobre obesidad. Octubre 2017. [Internet] (Cited: Jun 27, 2020). [Link]
- World Medical Association, WMA (2013) Declaration of Helsinki – Ethical principles for Medical Research Involving Human Subjects. [Internet] (Cited: Mar 04, 2020). [Link]
- Iafstore. (2016). Cálculo del IMC, morfología y grasa corporal. El nacimiento del Índice de Masa Corporal. [Internet] (Cited: Jul 13, 2018). [Link]
- Funes Ada. (2019). Cómo calcular el peso ideal según la estatura y la edad. [Internet] (Cited: Mar 21, 2020). [Link]
- Peso Ideal. (2014). [Link]
- García Del Pozo JA, Álvarez Martínez MO. (2002). Prevención y dietoterapia de la obesidad. OFFARM 21(7) JULIO-AGOSTO 2002. [Link]
- Superprof V. Entrenamiento personal: cómo saber cuál es nuestro peso óptimo. Calcular tu peso ideal. (Internet) (Cited: Jul 02, 2020) [Link]
Copyright: Bauce GJ, et al. © (2021). This is an open-access article distributed under the terms of the Creative Commons Attribution License, which permits unrestricted use, distribution, and reproduction in any medium, provided the original author and source are credited.
Citation: Bauce GJ, et al. (2021). Formulas for Determining Ideal Weight and Its Relationship to the Body Mass Index in Adults. Obese. 1(1):3.