2021: Volume 1, Issue 1
Past Issues
 Abstract
  PDF
PDFProposal for an Indicator for Overweight and Obesity: Weight Waist Circumference Index (WWCI)
Gerardo José Bauce*
1School of Nutrition and Dietetics. Faculty of Medicine. Central University of Venezuela.
*Corresponding author: Gerardo José Bauce, Master in Management. Full Professor of Statistics. School of Nutrition and Dietetics. Faculty of Medicine. Central University of Venezuela. Email: [email protected] Tel: 0412-5733044. http://orcid.org/0000-0002-6087-3968
Received: August 19, 2021
Published: October 12, 2021
SUMMARY
Objective to evaluate the WWCI, as an indicator of overweight and obesity, in three cities of Venezuela and the purpose of proposing it as an indicator of overweight and obesity. Materials and Methods: Descriptive, prospective and correlational study in a representative sample of 896 children and adolescents aged 6 to 15 years, 50.4% of whom were male. The variables sex, age, weight, height, Waist circumference (WC), Body Mass Index (BMI), Body Fat Percentage (BFP) and Weight-Waist Circumference Index (WWCI); means, deviation, correlations and ROC curve were determined. Results: Data show weight averages 43.1±14.8 kg; size 146.2±15.8 cm; BMI 19.6±3.6 kg/m2; WC 66.7±9.3 cm; BFP 15.5±7.3 and WWCI 0.64±0.2. Very good correlations between Size-Weight (0.87); Weight-BMI (0.84); Weight-WWCI (0.91); Size-WWCI (0.80) and BMI-WWCI (0.75); the percentages of children and adolescents, according to BMI and WWCI values, reveal Overweight 10.9% (BMI) and 11.6% (WWCI); Obesity 5.3% (BMI) and 5.8% (WWCI), according to percentiles. Overweight 4.1% (BMI) and 8.1% (WWCI); Obesity 0.3% (BMI) and 4.2% (WWCI), according to Mean and deviation. Overweight 7.2% (BMI) and 8.0% (WWCI); Obesity 3.3% (BMI) and 3.6% (WWCI), according to Fundacredesa. Averages, by sex, for weight, height, BMI, WC and WWCI, not significant; if the averages of the PGC (p<0,000). ROC curve moves away from the diagonal, coupled with the fact that the area under the curve is 0.983, reflects the goodness of the model, complemented by a high sensitivity and specificity, thus guaranteeing a discriminant power. Conclusion: The WWCI assessment reflects that it correlates with Weight, Height and BMI, classifies with similar and lower percentages, according to BMI criteria; the ROC curve reveals high Sensitivity and Specificity, which is why it is recommended as an indicator to evaluate overweight and obesity in children.
KEYWORDS: Weight-Waist Circumference Index, Body Mass Index, Overweight, Obesity.
INTRODUCTION
WHO has published information on overweight and obesity in children aged 5-9 years, according to which obesity in children and adolescents has increased from 1% in 1975 to almost 6% in 2016, equivalent to 50 million girls and 8% in boys representing 74 million boys; likewise, the increase in obesity in obese individuals aged 5 to 19 years, multiplied by 10 times worldwide, going from 11 million in 1975 to 124 million in 2016 [1].
The Majid E. study, which was published in The Lancet ahead of World Obesity Day on October 11 of 2017, identified 213 million overweight children and young people, and that 90% of the increase is due to the fact that there are many more overweight children. Additionally, the WHO emphasizes that in 1975 less than one percent of children and adolescents were overweight, while today the figure is almost six percent of girls and almost eight percent of boys, which means that it has been increasing rapidly, representing a public health problem [2].
According to an FAO report, obesity and overweight in Latin America and the Caribbean has increased with a greater impact on women, as well as an upward trend in children, as it affects 140 million people, being observed mostly in Caribbean countries, such as the Bahamas 36.2%, Barbados 31.3%, Trinidad and Tobago 31.1% and Antigua and Barbuda 30.9%. Likewise, the figures revealed that in Latin America and the Caribbean 7.2% of children less than 5 years of age were overweight, which represents 3.9 million children, of which 2.5 million live in South America, 1.1 million live in Central America, and 200,000 in the Caribbean [3].
In Venezuela, a study that public and private schools from eight cities revealed that the prevalence of obesity was 26.4% according to BMI and 26.5%, according to PGC [4]. The Comprehensive Treatment Center for Obesity (Cito Group Ve), conducted a study that revealed the obesity rate fell by a third between 2010 to 2017, going from 24% to 11%, overweight from 30% to 25% and morbid obesity from 1.8% to 0.6% [5].
WHO has recommended BMI as an indicator to evaluate overweight and obesity, both in children and adults, and this indicator has been used for many years and by a number of researchers. However, there have been proposals to modify this indicator, like Nick Trefethen proposal, for a new BMI calculation formula which is called the new formula for BMI [6]: BMI = 1.3*weight (kg)/height (m)^2.5 = 5734*weight (lb)/height (in)^2.5
In view of the above, it seemed feasible to propose the use of a new indicator, which I have called the Waist Weight-Circumference Index (WWCI), as an option to evaluate overweight and obesity, which may be a complementary indicator of BMI that would help a better assessment of overweight and obesity in population groups. This indicator has already been used in a study conducted by Bauce, et al., in Caracas city, and based on 655 subjects from different age groups [7].
The objective of our study was to evaluate the Weight Waist Circumference Index (WWCI) for 896 children representative sample, in Caracas city, in order to propose it as a complementary indicator for overweight and obesity diagnosis.
MATERIALS AND METHODS
This was a descriptive, cross-sectional, prospective and correlational study, based on a sample of 896 children from different educational institutions, to Caracas city, to evaluate overweight and obesity. This subjects had ages between 6 to 15 years; 452 (50.4%) males and 444 (49.6%) females. Representatives and teachers were informed about our study objectives, and informed consent was taken. With regard to the measurement of children and adolescents, the standards established in the Declaration of Helsinki were complied with [8].
BMI was calculated using the formula BMI=Weight (Kg)/Size2 (cm). The measurement of the Abdominal Circumference (AC) or Waist Circumference (WC), was performed using an inextensible tape measure, taking as a reference point the midpoint between the costal rim and the iliac crest, in expiration. The Weight Waist Circumference Index (WWCI) was obtained from the following relationship: WWCI= Weight (kg)/WC(cm); which relates a measure of body mass to a measure of abdominal fat [7].
Classification criteria:
For the BMI, the WHO criterion was considered: BMI<-3DE (Extreme Thinness): -3DE < BMI < -2DE (Thinness); -2DE < BM I< +1DE (Normal); +1DE < BMI < +2DE (Overweight); BMI > +2DE (Obesity) (WHO) [8,9].
The BMI values suggested by the CDC were: BMI < p5 (Low weight); P5 < BMI < P85 (Healthy Weight); P85 < BMI < P95 (Overweight) and BMI ≥ P85 (Obesity) [10].
BMI according to age and sex in the curves for Venezuelan children and adolescents carried out by FUNDACREDESA were: Low weight: BMI < p10; Healthy weight: P10 ≤ BMI < P90; Overweight: P90 ≤ BMI < P97 and Obesity BMI ≥ P97 [11,12].
The use of three criteria for BMI is due to the need to evaluate the WWCI indicator more confidently, comparing the classification in overweight and obesity, with international criteria and national criteria.
For children waist circumference (WC), the result obtained by Mederico, et al. (2013) [13] was considered, 68 cm for boys and 66 cm for girls, as well as what was used by Rincón, et al. (2015) [14].
The body fat percentage (BFP) was assumed as suggested by the SEEDO, the normal percentages of fat mass according to age in years, and for the group of 15 to 20 years, it has 18-22% for the female sex and 15-18% for the male sex [15].
For the Weight-Waist Circumference Index (WWCI), was chosen the criterion corresponding to the percentiles suggested by the WHO for BMI, considering that it is what best fits when classifying this indicator, and making a much more accurate comparison with relative values of the two indicators.
Descriptive statistical measures, correlation and regression, z-test for mean and percentage differences, and logistic regression were determined using Microsoft Excel software and Epidat 4.
RESULTS
The study group consisted of 896 children aged between 6 to 15 years old, from which 452 (50.4%) were boys; the averages are, weight 43.1±14.8 kg; size 146.2±15.8 cm; BMI 19.6±3.6 kg/m2; WC 66.7±9.3 cm; WWCI 0.64±0.2 and BFP 15.5±7.3. When differentiated by sex, weight is 43.9±14.8 kg (M) and 42.3±12.9 kg (F); Size 147.1±17.6 cm (M) and 145.3±13.7 cm (F); BMI 19.5±3.8 kg/m2 (M) and 19.6±3.5 kg/m2 (F); WC 66.4±8.37cm (M) and 67.0±9.9cm (F); ICT 0.45±0.05 (M) and 0.46±0.06 (F); WWCI 0.65±0.2 (M) and 0.63±0.2 (F), and BFP 10.1±5.0 (M) and 20.9±4.7 (F) (Table 1).
Table 1. Descriptive measures, according to sex, in the study group. Correlations and Percentage Comparison of BMI, WC and WWCI
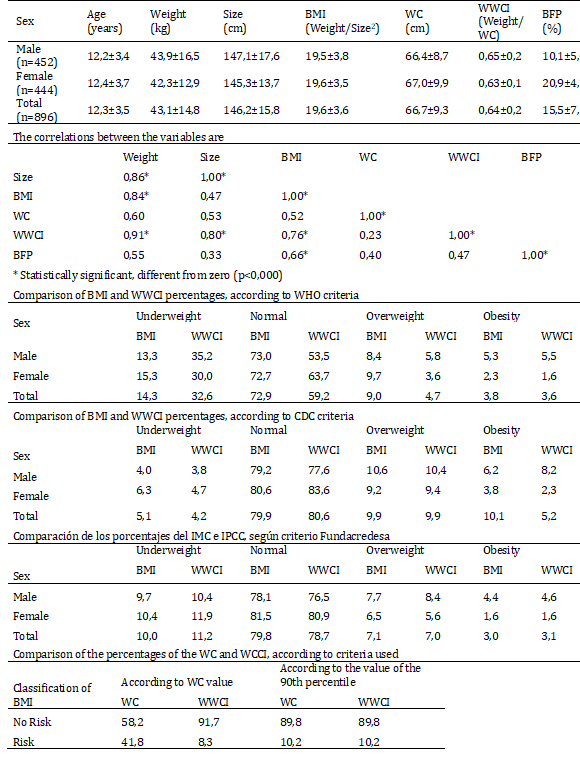
Correlations were obtained between Height and Weight (0.87); BMI-Weight (0.84); WWCI-Weight (0.91); Size-WWCI (0.80) and BMI-WWCI (0.75); especially highlight the correlations between the WWCI with Weight, Height and BMI. This correlation is evidenced in Figures 1, 2 and 3, where the direct relationship between the two variables is observed, as well as the value of the coefficient of determination R2, which in the case of Figure 1, indicates that the variability of the WWCI is explained in 84.9% by the variability of weight (Table 1).
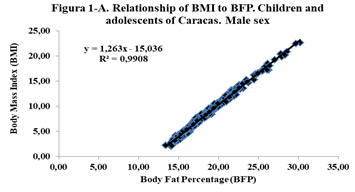
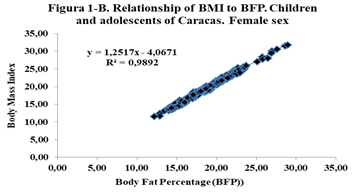
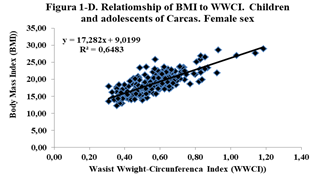
Figure 1. Relationship between BMI, BFP and WWCI, according to sex for children and adolescents of Caracas.
The criteria assumed as references are compared, and it has to be for WHO criterion: Deficit 14.3% vs 32.6%; Normal 72.9% vs 59.2%; Overweight 9.0% vs 4.7%; Obesity 3.8% vs 3.6%. For the CDC criterion: Deficit 5.1% vs4.2%; Normal 79.9% vs 80.6%; Overweight 9.9% vs 9.9%; Obesity 10.1% vs5.2%. For the Fundacredesa criterion, Deficit 10.0% vs 11.2%; Normal 79.8% vs 78.7%; Overweight 7.1% vs 7.0%; Obesity 3.0% vs 3.1% (Table 1).
Similarly, the percentages according to WC and WWCI values, at risk and non-risk are compared, and it is possible that, according to the criterion of the value of WC (68 cm and 66 cm), 58.2% in Non-risk and 41.8% in Risk, and the WWCI 91.7% in Non-risk and 8.3% in Risk, figures that differ and turn out to be statistically significant (p<0,000) Also when considering the criterion of the 90th percentile for WC, we have the following results: 89.8% in Non-risk and 10.2% in risk, figures equal to those of the WWCI classified according to this criterion (Table 1).
The comparison of the averages, by sex, for the variables weight, height, BMI, CC and IPCC, are not significant; on the other hand, the averages of the PGC are statistically significant (p<0.001); likewise, the Logistic Regression model reveals that the likelihood is significant (p<0.001), a sign that the model to evaluate the IPCC is coherent and reliable. Likewise, BMI is related to the BFP and the WWCI, by sex, through linear regression, and it is observed that there is a high direct and positive relationship between these variables, with a coefficient of determination greater than 0.64 (Figure 1).
The application of the Logistic Regression model, taking into account the quotient of likelihood, allows to affirm according to the R statistic, that the likelihood of the model is statistically significant (p<0,000), that is the model yields results consistent with the data used. On the other hand, the Wald coefficient turns out to be statistically significant (p<0,000), for the variables weight and waist circumference, which evidences the validity of the model used to estimate risk according to the WWCI. The Odds Ratio (OR) of each of the variables are for weight 1.415 with a confidence interval equal to (1.305-1.534) and for waist circumference 0.009 with a confidence interval equal to (0.002-0.045).
The Hosmer-Lemeshow Goodness of Fit test also turns out to be statistically significant, which evidences the validation of the model using the WWCI to estimate risk, based on weight and waist circumference.
P(X=1=Risk) = 1 / 1 + Exp (-19.681-0.35Weight-3.802CC)
Finally, the WWCI ROC Curve moves away from the diagonal, coupled with the fact that the area under the curve is 0.983, reflects the goodness of the model, complemented by a high sensitivity and specificity, thus ensuring a high discriminant power, with a higher point of sensitivity and specificity equal to (0.99;0.92) (Figure 2).
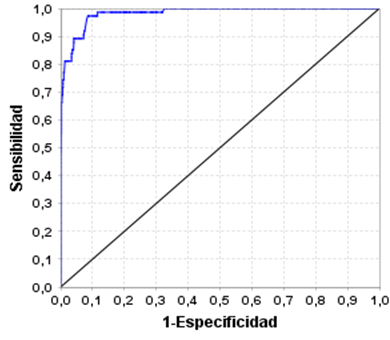
Figure 2. ROC curve of the Waist Weight-Circumference Index, with Weight and DC variables for Children and adolescents of Caracas (It can be observed that the curve is quite far from the diagonal, and for example, to refer to a cut-off point, which indicates the Sensitivity and the highest Specificity this is the point (0.99; 0.92))
DISCUSSION
The results obtained allow us to affirm that the measures used to evaluate overweight and obesity in this group of children and adolescents, BMI is still very useful; and considering that the IPCC classifies boys and girls, with similar percentages with overweight and obesity, to BMI, according to the three criteria, it is advisable to recommend it. The average BMI is similar to that obtained by Bauce (2011) [16], in a study of 304 schoolchildren from 5 to 19 years old, and when compared by sex, they are not significant (p<0.001) which coincides with what Bauce [17] referred to.
Another aspect that stands out is when comparing the averages by category of overweight and obesity, in overweight 13.6% (T), 10.6% (M) and 16.7% (F) with those reported by García-García, et al. [18], they have to be lower; and in obesity 3.0% (T), 1.5% (M) and 4.5% (F), also turn out to be lower.
On the other hand, the behavior of the average BMI increases with age, varying between 15.1 and 23.3 in and between 14.7 and 21.9, which is similar in behavior and slightly lower in the range, to the CDC reference for children and adolescents, for both sexes [19].
The classification of boys and girls, according to BMI percentiles, reveals that in Deficit, Normal, Overweight and Obesity, there are 15.1%; 69.6%, 10.3% and 5.0%, respectively, higher in Deficit and similar in the other categories, to those obtained by Camacho-Camargo, et al. (2009) [20] and equally similar to that referred to by Bauce (2011) [16] for overweight (10.2%) and obesity (5.3%). While overweight is higher and lower in obesity, as reported by Paoli, et al. (2009) [21]. Likewise, the percentages of overweight and obesity are lower than those obtained by Bauce [22], who reports 8.9% of overweight and 4.1% of obesity for a group of schoolchildren, values slightly lower than those of this study; It is also compared with the results of another study, in which it reports a prevalence of 8.9% overweight and 4.1% obesity, and that it is similar in boys and girls (8.6% vs 9.2%) [23].
It is also observed that the average BMI, when discriminating by age, these increase with age in girls, and in boys it decreases at 14 years, to then increase from 15 years to 18 years and decrease at 19 years; unlike that reported by Mederico, et al. (13), who obtained results showing that BMI increases with age in both sexes, remaining the same at the ages of 9 to 11 years, increasing from 12 to 18 years, in the female sex; while in men it increases from 9 to 11 years, it remains the same until 14 years and increases progressively until 18 years.
The WC was 66.7±9.3 cm, similar, for the total and by sex, to that reported by Bauce (2018) [24]. Likewise, the percentage of risk according to the WC is 10.0% equal to that reported by Paoli, et al. (2009) [19]. The average of the WC is higher than that reported by Bauce [25], which is 62.1±5.5 cm, in turn lower than that obtained by Hidalgo [26], which is 72.8 cm.
With regard to the BFP, our group had an average of 15.5±7.3, lower than that obtained by Bauce [24] (22.4±8.9), and values of 21.1±6.8 and 21.3±4.9 for males and females, respectively. However, when comparing by gender, the averages differ and are significant (p<0,001), unlike the previous ones which are similar. On the other hand, the correlation between BFP and BMI was 0.66, lower than that obtained by Medina-Bustos, et al. [27], with 0.86.
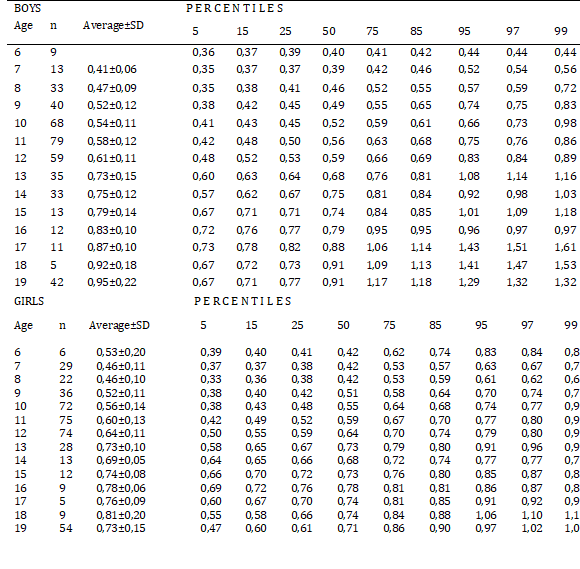
The WWCI average was 0.64±0.2 kg/cm (for all group), respectively 0.65±0.2 kg/cm (for boys) and 0.63±0.2 kg/cm (for girls), both of which are higher than those reported by Bauce, et al. [7], but not statistically significant. It is held in the same way that these averages, by sex, are similar to those in another study, by Bauce [25]. Although the first averages are significant, it is observed that the difference is small, and in the second it is observed that the averages are very similar.
The percentages that result from classifying the WWCI according to the criteria and comparing them with the BMI, allow us to affirm that with the WHO criterion the percentage in Overweight is higher for the BMI and similar in Obesity; with the CDC criterion the percentages are similar except in Obesity which is higher than the BMI; with the Fundacredesa criterion, the percentages are simulated in all four categories, which may be due to the fact that this criterion is more associated with the Venezuelan population.
The WWCI average increases with age, both in males and females, except for the latter, which decreases at age 14, then increases from age 15 to age 18 to decrease at age 19. On the other hand, when considering the WWCI percentiles, it is observed that, in general terms, the value of WWCI increases with age in both sexes, with the exception of which decreases between eleven and twelve years, and in which decreases at fourteen years. (Tables 2 and 3).
Table 2: Behavior of BMI averages and percentiles, by age and sex, in Caracas city
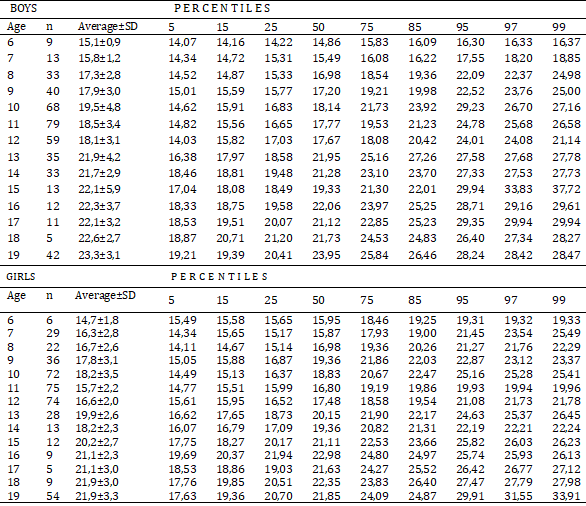
Table 3: Behavior of IPCC averages and percentiles by age and sex
In view of the behavior of BMI, similar to BMI, correlates with Weight, Height and BMI, in relation to the results obtained in other studies, which is equivalent, the IPCC could be considered as an acceptable indicator to evaluate overweight and obesity, taking into account that it also behaves in a similar way to BMI, particularly when age and percentiles are taken into account; even more so when the comparison of the percentages of incidence, by categories with the BMI, according to the criteria of the Venezuela Project (FUNDACREDESA), are similar.
This aspect is further evidenced by applying Logistic Regression, which showed results that indicated a normal behavior for the WWCI values, an area under the curve of 0.98, in addition to a high Sensitivity and a high Specificity, which guarantee a discriminative capacity for the WWCI [29].
CONCLUSION
According to the results, it can be concluded that the Weight Waist Circumference Index (WWCI) is an indicator that is very useful to diagnose overweight and obesity in children and adolescents. Firstly because it is easy to be calculated, secondly, Logistic Regression reveals that the WWCI model, according to likelihood, yields consistent results, is reliable according to the Goodness of Fit test of Hosmer and Lemeshow, and allows us to verify that the ROC curve moves away from the diagonal and the area under the curve is 0.983, revealing the discriminative capacity of the model, with a high sensitivity (0.98) and specificity (0.92).
We sustain also that although BMI is a reliable indicator of body fat in most people, in the case of very muscular individuals this index may not accurately represent the fat content of the body [28], which is why the WWCI can be considered as an alternative to evaluate overweight and obesity, particularly in children and adolescents, by complementing the measurement of fat in the body.
REFERENCES
- World Health Organization. Obesity among children and adolescents has increased 10-fold in the past four decades. Press Release. October 11, 2017. London. [Link]
- Majid Ezzati. Imperial College of London. Pándemico Dialogue. 1-10-2017. Deutsche Welle (DW). [Link]
- FAO-PAHO. Overweight affects almost half of the population of all countries in Latin America and the Caribbean except Haiti. Santiago, Chile, January 19, 2017. [Link]
- Herrera-Cuenca Marianella, Velásquez Jesús, Rodríguez Greta, Berrisbeitia Mariela, et al. (2013). Obesity in Venezuelan schoolchildren and risk factors for the development of type 2 diabetes. An Venez Nutr. 26(2):95-105. [Link]
- Comprehensive Treatment Center for Obesity (CitoGroupVe). That's Margarita.com.1 November, 2019. [Link]
- Nick Trefethen. University of Oxford. New body mass index. [Link]
- Bauce G, Moya-Sifontes M. (2020). Waist Circumference Weight Index as a complementary indicator of overweight and obesity in different groups of subjects. Rev Digit Postgraduate. 9(1):e195. doi: 10.37910/RDP.2020.9.1.e195 [Link]
- World Medical Association, WMA. (2013). Declaration of Helsinki – Ethical principles for Medical Research Involving Human Subjects. [Link]
- De Onis Mercesdes. World Health Organization reference values. ECOG. [Link]
- Centers for Disease Control and Prevalence (CDC). About body mass index for children and adolescents. [Link]
- López M, Landaeta M. (1991). Manual de crecimiento y desarrollo. Caracas SVPP: Laboratorios Serono. FUNDACREDESA.
- Fundacredesa. (1996). Estudio Nacional de Crecimiento y desarrollo Humanos de la República de Venezuela. Proyecto Venezuela. Caracas, Venezuela.
- Mederico Maracally, Paoli Mariela, Zerpa Yajaira, Briceño Yajaira, et al. (2013). Valores de referencia de la circunferencia de la cintura e índice de la cintura/cadera en escolares y adolescentes de Mérida, Venezuela: comparación con referencias internacionales. 60(5):235-242. [Link]
- Yorgi R, Mariela P, Yajaira Z, Yajaira, B, et al. (2015). Sobrepeso-obesidad y factores de riesgo cardiometabólico en niños y adolescentes de la ciudad de Mérida, Venezuela. Investigación Clínica. 56(4):389-405. [Link]
- Gottau Gabriela. (2010). Sociedad Española para el Estudio de la Obesidad (SEEDO). Updated: 27 March 2017. [Link]
- Bauce Gerardo. (2011). Comparación entre referencias del IMC, para obesidad y sobrepeso, en niños de tres ciudades de Venezuela. INHRR. 42(1):07-15. [Link]
- Bauce G. (2019). Comparación entre el IMC tradicional y el IMC Oxford y su relación con otros indicadores, en niños y adolescentes. Rev. Inst. Nac. Hig. “Rafael Rangel”. 50(1-2):22-29. [Link]
- García-García Emilio, Vázquez López María-Ángeles, Galera Martínez Rafael, Alias Irene, et al. (2013). Prevalence of overweight and obesity in children and adolescents aged 2-16 years. Elsevier Doyma. Endocrinología y Nutrición. 60(3):121-126. [Link]
- Centers for Disease Control and Prevention. National Center for Health Statistics. Anthropometric Reference Data for Children and Adults: United States, 2011–2014. [Link]
- Camacho-Camargo Nolis, Alvarado Jorge, Paoli Mariela, Molina Zarela, et al. (2009). Relación entre el índice de masa corporal y las cifras de tensión arterial en adolescentes. Rev Venez Endocrinol Metab. 7(2):17-24. [Link]
- Paoli Mariela, Uzcátegui Lilia, Zerpa Yajaira, Gómez-Pérez Roald, et al. (2009). Obesidad en escolares de Mérida, Venezuela: asociación con factores de riesgo cardiovascular. Endocrinología y Nutrición. 56(5):218-226. [Link]
- Bauce Gerardo J. (2018). Estudio comparativo del porcentaje de grasa corporal en niños y adolescentes de tres ciudades de Venezuela: 2008 – 2010. Rev. Inst. Nac. Hig. “Rafael Rangel”, 49(2):24-32. [Link]
- Bauce G. (2018). Obesity in children and adolescents, as measured by BMI and ideal weight: case educational institutions in Caracas, Venezuela. MOJ Biol Med. 3(3):58-62. [Link]
- Bauce G. (2018). Three indicators for overweight and obesity: BMI, CC and P/CC-index in children and adolescents: Pilot study. MOJ Biol Med. 3(3):120-125. DOI: 10.15406/mojbm.2018.03.00086. [Link]
- Bauce Gerardo. (2017). Relación entre el IMC, Circunferencia de Cintura e Índice de Forma del Cuerpo (ABSI) en niños y adolescentes. Revista del Instituto Nacional de Higiene “Rafael Rangel”, 48(1-2):67-81. [Link]
- Hidalgo G, Flores-Torres J, Rodríguez-Morales AJ, Vásquez E, et al. (2011). Determinación de puntos de corte para la circunferencia de cintura a través de curvas ROC en población pediátrica de tres regiones de Venezuela evaluada en el SENACREDH. Arch Venez Puer Ped. 74(3). [Link]
- Medina Bustos Marcos, Luizaga Lopez Marcela, Abasto Gonzales Susan, Mamani Ortiz Yercin, et al. (2017). Masa grasa corporal en escolares y adolescentes en la zona de la Tamborada Cochabamba, Bolivia. Gac Med Bol. 40(1):10-13. [Link]
- Chaparro Camila, Lutter Chessa. (2015) Peso inferior al normal, talla baja y sobrepeso en adolescentes y mujeres jóvenes en América Latina y el Caribe. Organización Panamericana de la Salud. p 1-12. [Link]
- Cerda Jaime, Cifuentes Lorena. (2012). Uso de curvas ROC en investigación clínica: Aspectos teórico-prácticos. Rev. chil. infectol. 29(2):138-141. [Link]
Copyright: Bauce GJ. © (2021). This is an open-access article distributed under the terms of the Creative Commons Attribution License, which permits unrestricted use, distribution, and reproduction in any medium, provided the original author and source are credited.
Citation: Bauce GJ. (2021). Proposal for an Indicator for Overweight and Obesity: Weight Waist Circumference Index (WWCI). Obese. 1(1):2.